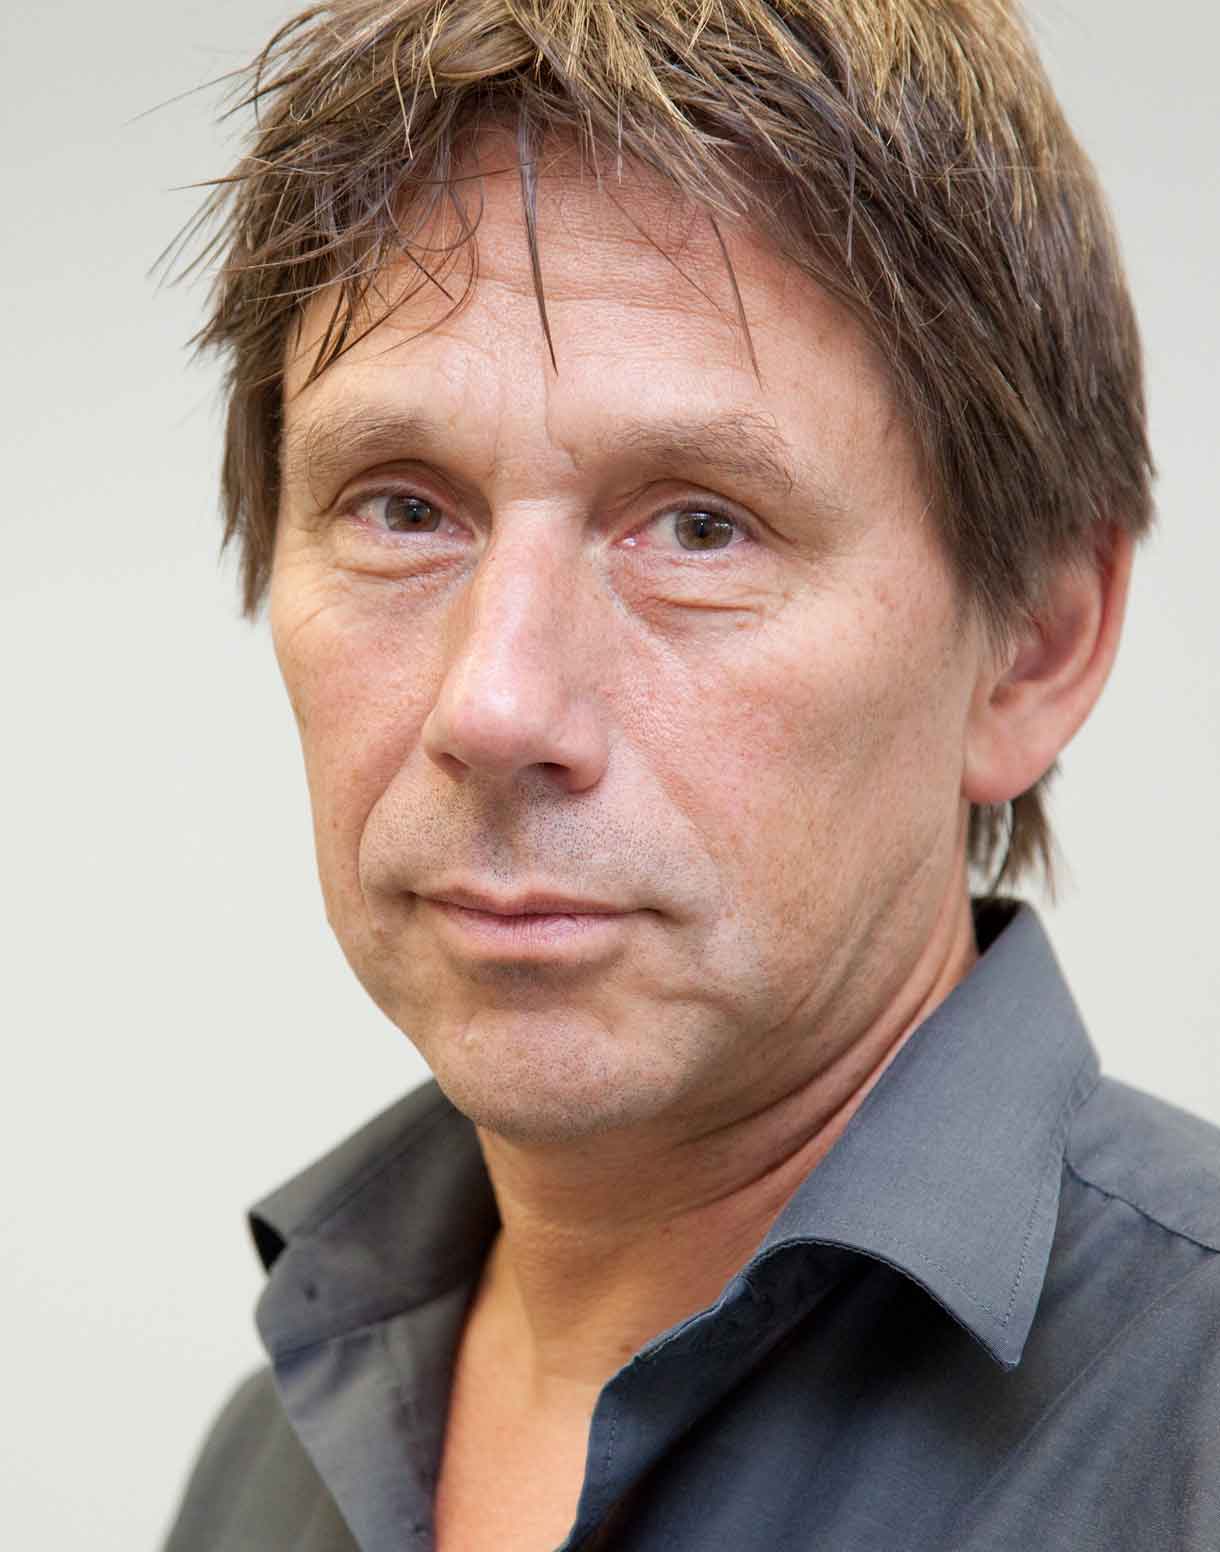
| Speaker: | Pierre Dillenbourg, EPFL |
| Date: | November 5, 11.00 EDT (view in your time zone) |
| Talk: | Hangout on air |
| Video only (YouTube) |
Abstract
The goal of orchestration graphs is to describe how rich learning activities, often designed for small classes, can be scaled up to thousands of participants, as in MOOCs. A sequence of learning activities is modeled as a graph with specific properties. The vertices or nodes of the graph are the learning activities. Learners perform some of these activities individually, some in teams and other ones with the whole class. The graph has a geometric nature, time being represented horizontally and the social organization (individual, teams, class) vertically. These activities can be inspired by heterogeneous learning theories: a graph models the integration of heterogeneous activities into a coherent pedagogical scenario. The edges of the graph connect activities. They represent the two-fold relationship between activities: how they relate to each other from a pedagogical and from an operational viewpoint. From the operational viewpoint, edges are associated to operators that transform the data structures produced during a learning activity into the data structures needed to run the next activity.
From the pedagogical viewpoint, an edge describes why an activity is necessary for the next activity: it can for instance be a cognitive pre-requisite, a motivational trick, an advanced organizer or an organizational constraint. The extent to which an activity is necessary for the next one is encompassed in the weight of an edge. The transition between two activities is stored as a matrix: the cell (m,n) of a transition matrix stores the probability that a learner in cognitive state m will evolve to state n in the next activity.. The transition matrix can be summarized by a parameter that constitutes the edge weight: an edge between two activities has a heavy weight if the learner performance in an activity is very predictive of his success of the connected activity. The graph also constitutes a probabilistic network that allows predicting the future state of a learner. An orchestation graph describes how the scenario can be modified, stretched, cut, extended.
Speaker Bio
A former teacher in elementary school, Pierre Dillenbourg graduated in educational science (University of Mons, Belgium). He started his research on learning technologies in 1984. He obtained a PhD in computer science from the University of Lancaster (UK), in the domain of artificial intelligence applications for educational software. He has been assistant professor at the University of Geneva. He joined EPFL in 2002. He is currently full professor in learning technologies in the School of Computer & Communication Sciences, where he is the head of the CHILI Lab: "Computer-Human Interaction for Learning & Instruction ». He is also the academic director of Center for Digital Education, which implements the MOOC strategy of EPFL. EPFL recently passed over 1 million MOOC registrations. He recently wrote a book entitled "Orchestration Graphs" that proposes a formal language for instructional design (EPFL Press).